

In my field of work— Semiconductor Research and Development (R&D)—most projects share a common characteristic: they are pathfinder projects. This means we are clear about the goals we want to achieve, but the path to reach them is often uncertain. We operate in a multifactorial environment, where many variables interact and evolve, adding an inherent level of complexity to our work.
I started exploring the concept of process complexity in project management literature. My journey began with the work of Marian Bosch-Rekveldt from Delft University of Technology. She expanded on the TOE framework — which stands for Technical, Organizational, and Environmental — originally introduced by Tornatzky and Fleischer in their 1990 book The Processes of Technological Innovation.
One key takeaway from my readings so far is this: assessing the level of complexity is the first essential step when taking on a new project. It helps you identify the right stakeholders early on and it is the foundation for effective risk management.
But what exactly does complexity mean in the context of project management?
According to Cooke-Davies et al. (2007), complexity can be understood by looking at a set of specific project properties. I’ve summarized these properties in the table below.
In short, we can group complexity into five key characteristics:
Emergence Complex systems display behaviors and patterns that arise from the interactions of their components, which cannot be predicted by analyzing the individual parts alone.
Indeterminacy Outcomes in complex systems are inherently uncertain and unpredictable due to the dynamic interplay of various factors.
Nonlinearity In complex systems, small changes can lead to disproportionate effects, making cause-and-effect relationships difficult to establish.
Interrelatedness Components within complex systems are highly interconnected, meaning that a change in one part can significantly impact others.
Dynamics Complex systems are constantly evolving over time, with their structure and behavior changing in response to internal and external influences.
The TOE framework focuses on three key areas where complexity can arise in projects: Technical, Organizational, and Environmental. These dimensions provide a structured way to identify and understand the sources of complexity in different project settings.
Technical Aspects: Focus on the project’s technical details, including its goals, scope, tasks, the team’s experience, and associated risks. These elements deal with the direct challenges of completing the project’s technical requirements.
Organizational Aspects: Concerned with how the project fits and functions within the organization, including the availability of resources, the composition and dynamics of the project team, the level of trust among team members, and organizational risks. These factors address the internal context and management of the project.
External Aspects: Cover the project’s external environment, involving stakeholders, geographical location, market conditions, and external risks. Although not explicitly defined by Baccarini, these aspects are crucial for understanding the broader influences and challenges that can impact a project from outside the organization.
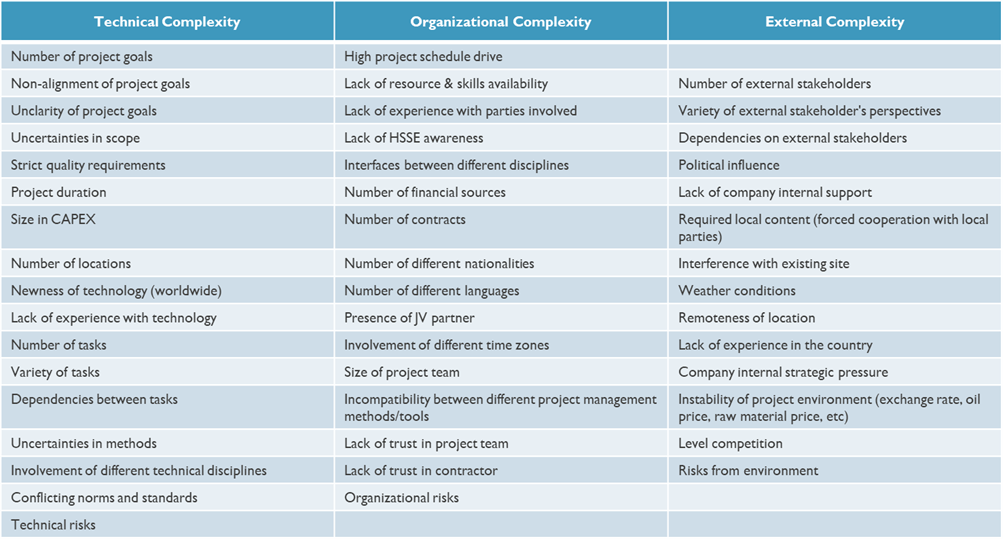
Table 1: Elements of the version of the TOE framework (Bosch-Rekveldt et al., 2010b).The TOE framework is based on research in the process industry.
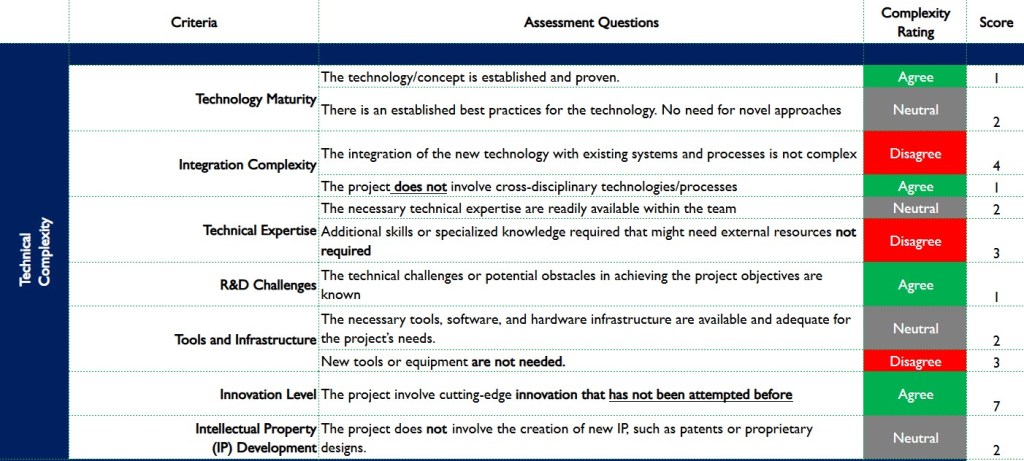
Starting from the TOE framework, I created a customized model that better fits the type of work we do in our domain. The goal was not only to identify the main sources of complexity, but also to make the evaluation easier to use in practice. To do this, I turned the framework into a checklist with an attached scoring model. This tool helps project managers, when presenting a new project or problem, to clearly identify the most critical complexity areas—whether they are technical, organizational, or environmental. I also added intellectual property (IP) as an extra factor, since it often plays an important role in our projects.
Each complexity factor is scored, and the total score gives a quick idea of how complex the project is—whether it’s moderate,or high. This makes it easier to plan attention based on how challenging the project is expected to be.
My customized model is shown in the below.


The first and most intuitive application of this model is to map the project portfolio using three variables: project complexity (X-axis), project duration (Y-axis), and estimated revenue (bubble size). This visual tool can support the strategy team in making critical decisions, such as prioritizing resources and defining strategic directions.
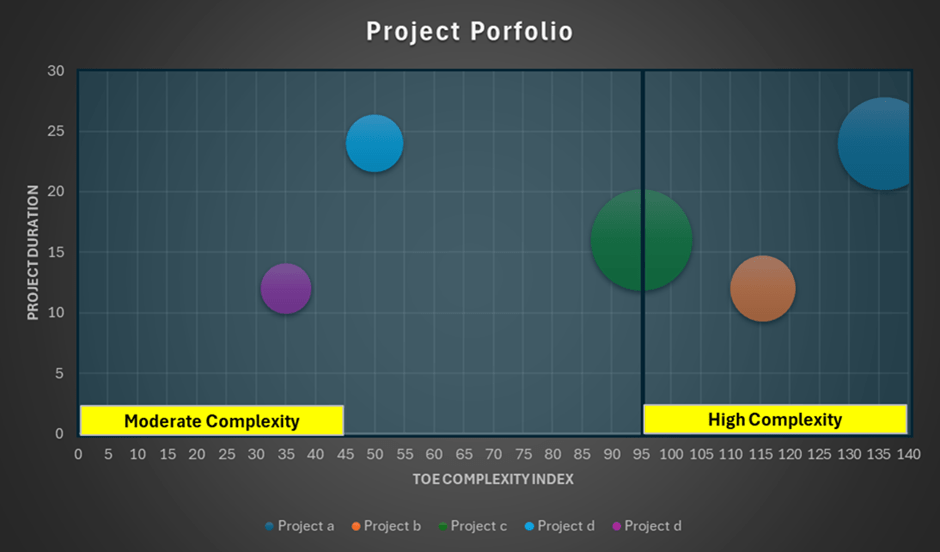
Chart 3 : Example of possible portfolio representation
I started asking myself whether — and how — the output coming from the project complexity assessment could be used as a factor in developing a model to estimate how much time a Project Manager should dedicate to a project.
One of the main challenges we often face is, in fact, how to correctly size the Project Manager’s involvement. Since their availability is limited — and they often have to manage a portfolio of projects, it becomes crucial to allocate their time wisely. Understanding how much time each project realistically requires helps us evaluate how many projects a Project Manager can handle without compromising quality or efficiency.
I started then with a set of basic assumptions :
- Project Manager effort might not be constant. It varies depending on two key factors: the seniority of the project manager and the complexity of the project. At the beginning of the project, the PM’s time allocation is at its maximum, as early phases typically require strong guidance, alignment, and team coordination. As the project reaches its first meaningful milestone and the team gains autonomy, the PM’s involvement begins to decrease progressively, aligning with increasing project maturity.
2. The rate of decrease in effort is:
- Directly proportional to PM seniority: a more senior PM delegates more efficiently and enables the team faster.
- Inversely proportional to project complexity: higher complexity requires sustained attention and slower disengagement.
Based on these assumptions, I tried to setup a model to mimic the theoretical trend : a flat phase of constant effort followed by a declining phase, where the decay rate reflect both seniority and complexity parameters.
- Tpm = Project Manager time (% of the overall project duration)
- Tpm_max = Maximum Project Manager time. Initial phase.
- Tpm_min= Minimum involvement of the Project Manager
- Tm = Time to reach the first meaningful milestone
- k= Time reduction speed as function of
- Spm = Seniority of the Project Manager (0=Junior , 1=Senior)
- Cpj= Project Complexity (Normalized value from the TOE, between 0 and 1)
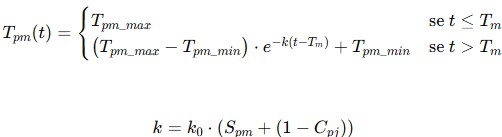
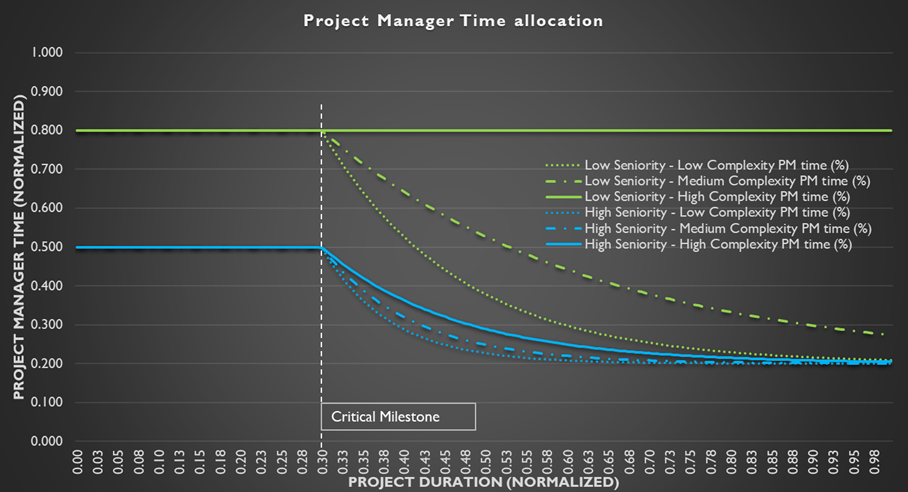
Chart 4 : Graphic representation of the sizing model
Conclusion
This model is just a starting point — an attempt to better understand and manage the link between project complexity and the time commitment required from Project Managers. It’s far from perfect, and I’m fully aware that real-life projects often behave differently than models predict.
Still, putting structure around these ideas has helped me reflect more clearly on how we plan and allocate our limited resources in complex R&D environments. My hope is that this approach, even in its simplicity, can spark further thoughts or be adapted by others facing similar challenges.
I’d be truly interested to hear how others approach the same problem.
This is very much a work in progress, and I’m sure there’s a lot I can learn from your experiences too.
References :
- Bosch-Rekveldt, M. G. C., Mooi, H. G., Bakker, H. L. M., & Verbraeck, A. (2011). Grasping project complexity in large engineering projects: The TOE (Technical, Organizational and Environmental) framework. International Journal of Project Management, 29(6), 728–739. https://doi.org/10.1016/j.ijproman.2010.07.008
- Bosch-Rekveldt, M. G. C. (2011). Managing project complexity: A study into adapting early project phases to improve project performance in large engineering projects (Doctoral dissertation, Delft University of Technology). https://repository.tudelft.nl
- Cooke-Davies, T., Cicmil, S., Crawford, L., & Richardson, K. (2007). We’re not in Kansas anymore, Toto: Mapping the strange landscape of complexity theory, and its relationship to project management. Project Management Journal, 38(2), 50–61.
- Baccarini, D. (1996). The concept of project complexity – A review. International Journal of Project Management, 14(4), 201–204. https://doi.org/10.1016/0263-7863(95)00093-3
- Cicmil, S., Cooke-Davies, T., Crawford, L. H., & Richardson, K. A. (2009). Complexity and the paradox of project control. https://www.researchgate.net/publication/44958333
- Faraji, F., Javadpour, A., Sangaiah, A. K., & Zavieh, H. (2023). A solution for resource allocation through complex systems in fog computing for the internet of things. Computing, 106, 2107–2131. https://doi.org/10.1007/s00607-023-01199-1
- Nauta, S. (2011). Investigating project complexity at NXP Semiconductors B.V.: An exploratory study based on the TOE framework (Master’s thesis, Delft University of Technology).
- Remington, K., Zolin, R., & Turner, J. R. (2009). A model of project complexity: Distinguishing dimensions of complexity from severity. In Proceedings of the 9th International Research Network of Project Management Conference (IRNOP), Berlin.
- Solomon, S., & Shir, B. (n.d.). Complexity: A science at 30. Complexity.
- Williams, T. (2002). Modelling complex projects. John Wiley & Sons. https://www.wiley.com/en-us/Modelling+Complex+Projects-p-9780471899453
AI Engagement Transparency Matrix
| Area of Application | Performed By |
| Literature Research | Author |
| Literature Processing | Author |
| Reference Formatting | ChatGPT |
| Concept Clarification | Author |
| Editing | Author |
| Refinement | ChatGPT |
| Visual Aids | Author |
| Mathematical Model Preparation | Author |
| Mathematical Model Validation | ChatGPT |
| Fact and Citation Checking | Author |
Article Word Cloud

Hi Paolo, interesting article. I like your way to characterize the complexity in 3 dimensions. Can you explain how you quantify the complexity using the TOE index ? I see Table 2 with “Agree/Disagree” statements. How do you create a TOE index from this ?
LikeLike
Thanks for stopping by Baudouin!
I tried to make it easy for the project manager to fill out by using a simple Approve/Disapprove choice.
One thing not shown in the picture (my mistake) is an extra column that converts each choice into a number. When you add up all the numbers, you get a total score. This score shows how complex the project is.
The threshold for complexity was set “experimentally” by running this tool on known past projects where the complexity had been assessed based on experience.
You can also give more importance (weight) to certain questions if they are more critical.
I hope this makes it clearer!
LikeLike